
A decision tree is a visual representation of a decision that breaks down the different options, objectives, and outcomes into an easily understood graphic. Creating a decision tree makes otherwise complex decision-making processes simple and organized. By using a decision tree, one can quickly identify potential benefits or drawbacks associated with a decision, weigh the options against each other, and make an informed decision about their next steps. Thus, decision trees are an invaluable tool for any organization or individual looking to better their decision-making process. Keep reading to learn how they work.
Transcript continues after video.
Flying Logic Setup
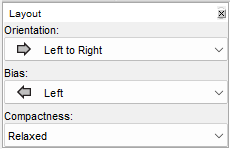
In our example, we use the Left to Right Orientation. However, like many other trees, this can be changed to any linear orientation of your liking.
The Bias will be whichever end your decision tree begins. In our example, the Bias is set to Left.
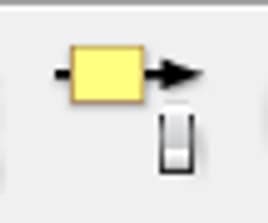
You should also ensure that the edge annotations are on by default. Do this by clicking the “Edge Annotations” icon in the top toolbar of the document until the switch is flipped upwards and the icon is vibrant, like so:
The Decision Tree domain we use in our example contains two entities, a Decision Entity and an Action Entity.
Unfortunately this domain is not available in default Flying Logic.
Instead, you can find a file containing the domain we use in our example here. The first file is a PDF document of the example tree, the second is an editable Flying Logic document with the example tree, and the third is a blank Flying Logic document containing the Decision Tree domain, as well as the necessary settings already changed for you.
Alternatively, the General domain will work for this tree, or you could create your own domain.
Step 1: Determine the Overarching Decision
The first step in creating a decision tree is determining what the overarching decision is. To illustrate, the overarching decision in our diagram is, “What should I do today?”
This can be a personal decision, or an organizational decision. An example we use later in the article has the overarching decision “Should we run a new ad campaign or improve an existing product?” These overarching decisions change based on your situation and purpose for creating one.
Step 2: Begin Building Branches
The next step in building a decision tree is to begin the branches. These consist of chains of Decision entities, each branching off into two or more options, and then ultimately ending with an Action Entity.
Decision entities can be two things, either a situational prerequisite or a choice that needs to be made. To illustrate, a situational prerequisite could be the type of weather outside, the number of employees working on a project, or the price of a certain stock, depending on your tree’s overarching decision.
A situational prerequisite could be “What’s the weather like outside?” This is a factor completely out of your control, that requires no personal decision to be made. A choice could be something along the lines of, “Do I want to spend time alone?” This relies on your personal input, instead of the situation you’re in.
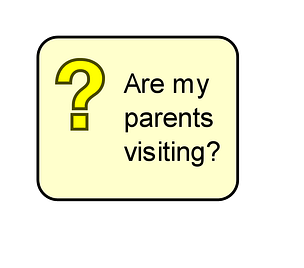
To begin our diagram, we add the first decision that needs to be made or the first situation we may encounter to the canvas. Do this by dragging and dropping a Decision Entity onto the canvas. In our example, this is if one’s parents will be visiting on the given day.
Then, we branch this off into its different outcomes: the parents are visiting, or the parents are not visiting. Do this by adding any actions or other decisions that each branch leads to. Also, in order to make it clear which option leads to each outcome, write a yes or no clarification in the edge annotations.
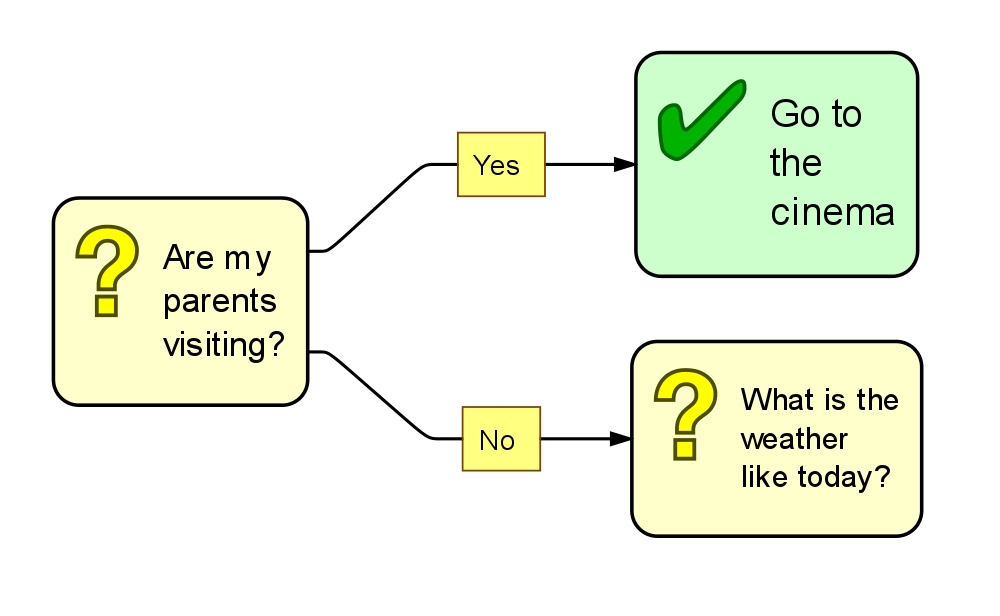
So, when the parents are visiting, it leads directly to the “Go to the cinema” Action Entity, meaning you will go to the cinema that day. Alternatively, when the parents are not visiting, it branches onto the next decision, “What is the weather like today?”
Step 3: Expand the Tree Further
Continue this process until you reach all of the Action Entities possible, meaning all of your branches end in an Action Entity.
When you’re finished, your diagram will look similar to this:
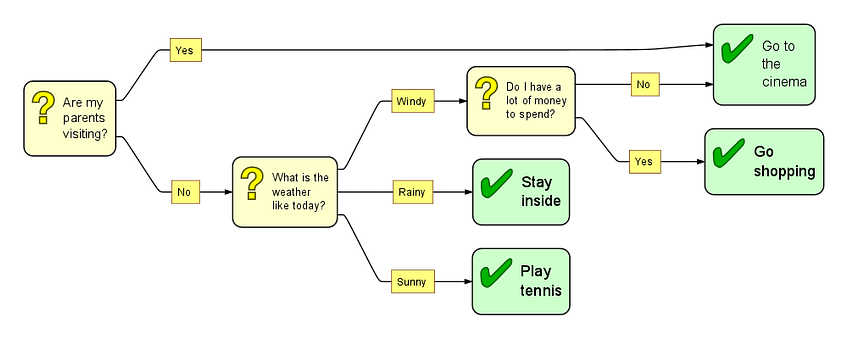
Every branch ends with an action, and some branches lead to the same action. Either way, there are no loose ends and our tree is finished.
Step 4: Evaluate Choices and Make Your Decision
A decision tree visualizes one-time decisions as well as decisions that are made on a regular basis and depend on a plethora of factors. The method and detail that go into evaluating your decisions will vary depending on the tree and the situation. Our above example requires little evaluation, as most of the options are yes or no and depend on factors in the situation.
However, if you’re dealing with a decision that incorporates major risks or rewards, there will be more evaluation that needs to happen. For example, if your decision tree is helping decide if you should run a new ad campaign or improve an existing product, the stakes will be much higher and the evaluation needs to be more detailed. There are a few steps in this process.
Step 1: Assign Monetary Profits to Outcomes
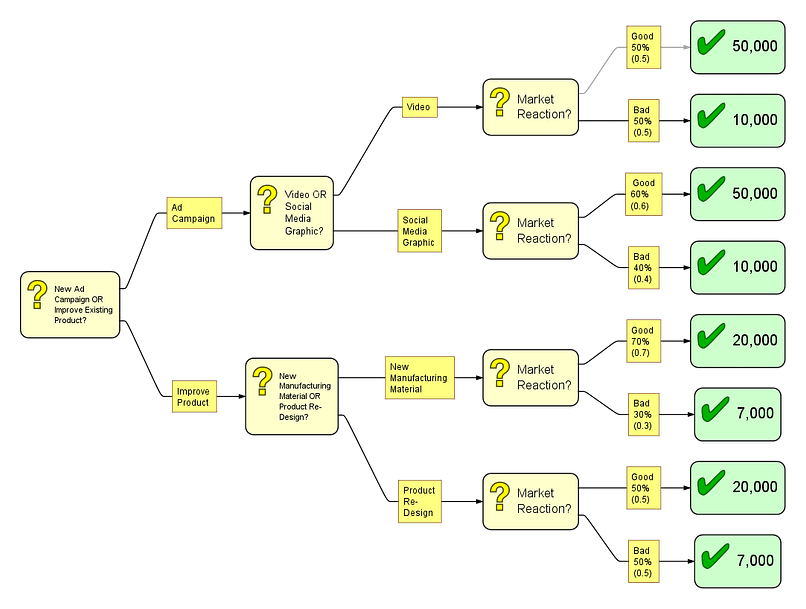
The diagram outlining the decision between re-designing a product or running a new ad campaign currently looks as such:
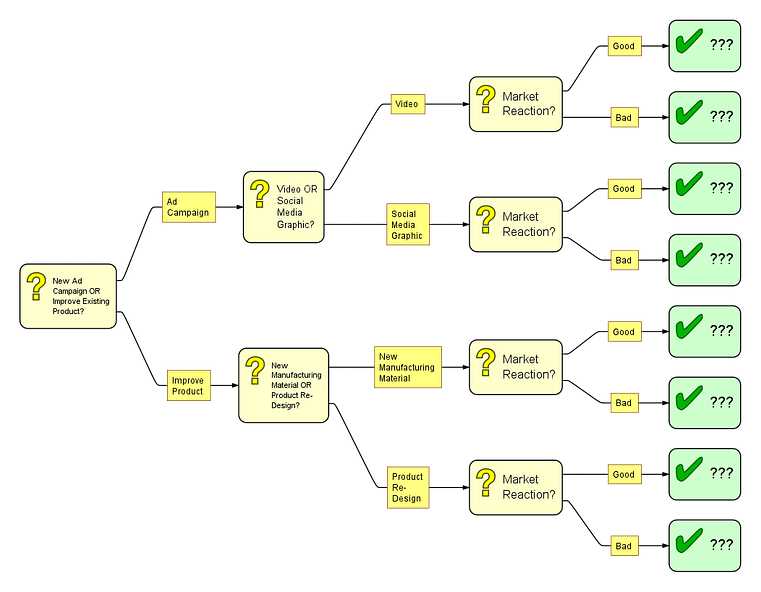
As you can see, there are a quite a few outcomes. These are uncertain outcomes, meaning they’re going to be predictions. You don’t know the exact profit of using a new manufacturing material with a Good market reaction, because you can’t see into the future. Instead, you should reference past data and research in order to estimate the profit.
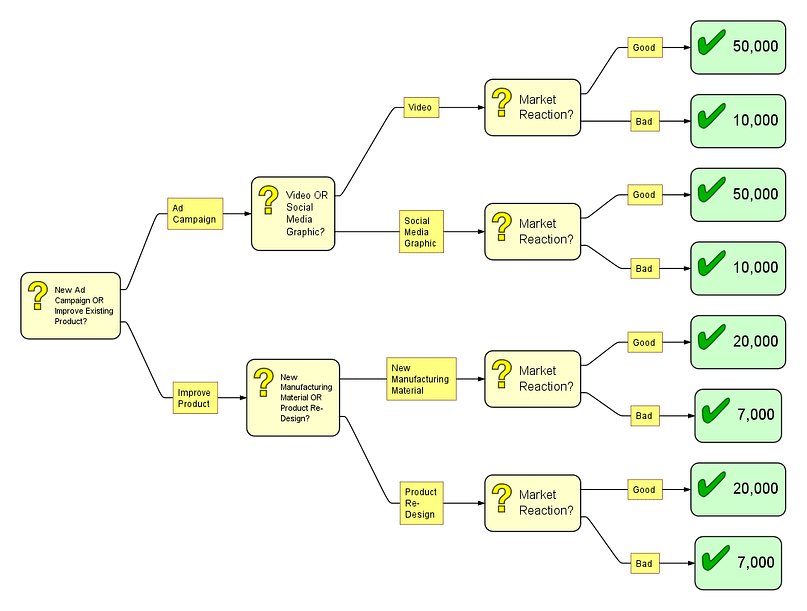
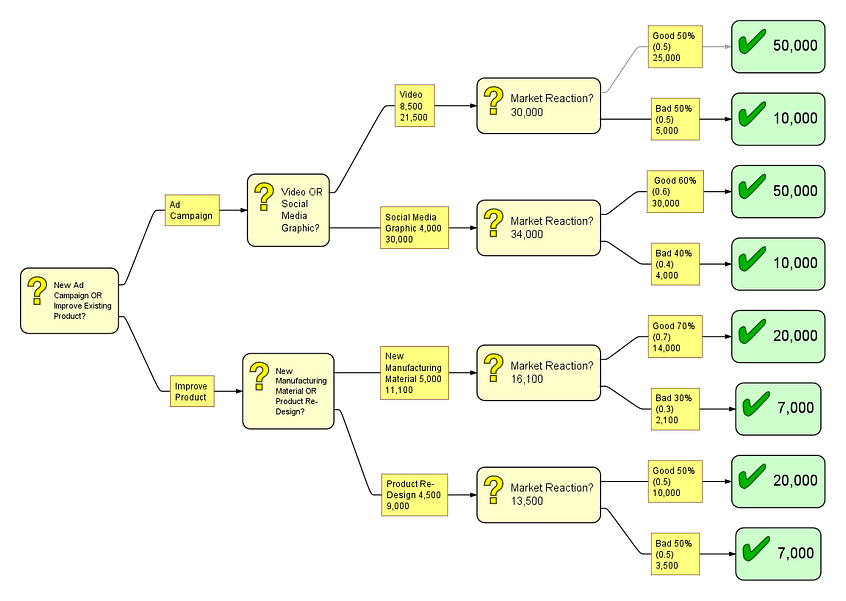
After adding monetary value to all outcomes, our diagram looks like this:
Step 2: Assign Probability Values to Uncertain Branches
The next step is to predict and assign probability values to the different options stemming from each decision. For example, there may be a 50/50 chance of a Good market reaction to a Video advertisement. Therefore, we assign that option a 50% (or 0.5 for calculation purposes). Of course, there’s no way of knowing the exact probability of a future event, so like above, these values are going to be predictions based off of past data and research.
All the options that stem from a given Entity must add up to 100%. Returning to our example, this means that because there is a 50% chance of a Good market reaction to a Video advertisement, there is also a 50% chance of a Bad market reaction.
Probability values are added to the annotation boxes of their respective options, like so:
Step 3: Calculate Existing Values
This step consists of calculating all the values we’ve already established.
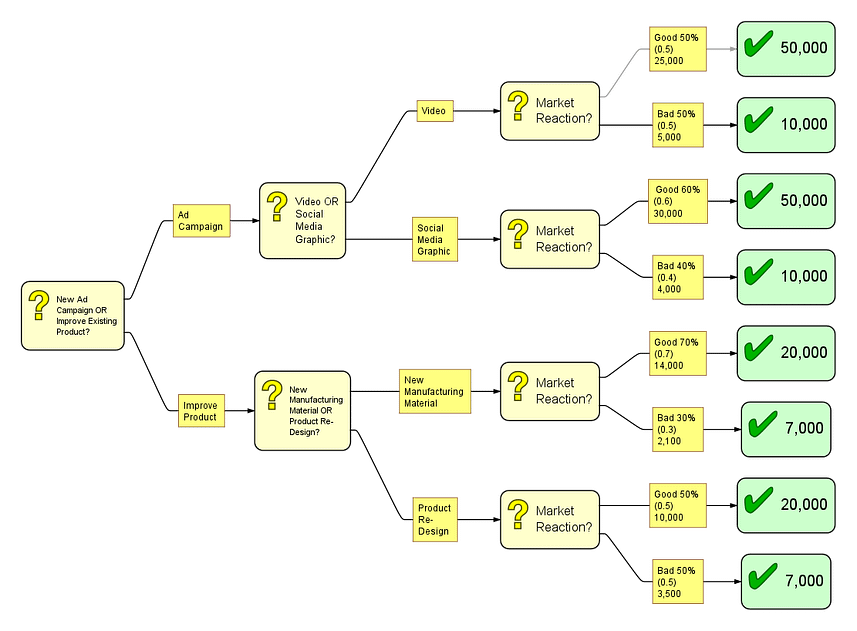
Firstly, calculate every outcome (the Action Entities) with its respective probability (recorded in the annotation box preceding the Action Entity) by multiplying the values like so:
(Outcome) x (Probability) = Value
To illustrate, the calculations for an Video ad campaign with a Good market reaction will look like so:
(50,000) x (0.5) = 25,000
Repeat this equation for every outcome and respective probabilities. Record the resulting values in the annotation boxes, along with the probability values. This results in something similar to this:
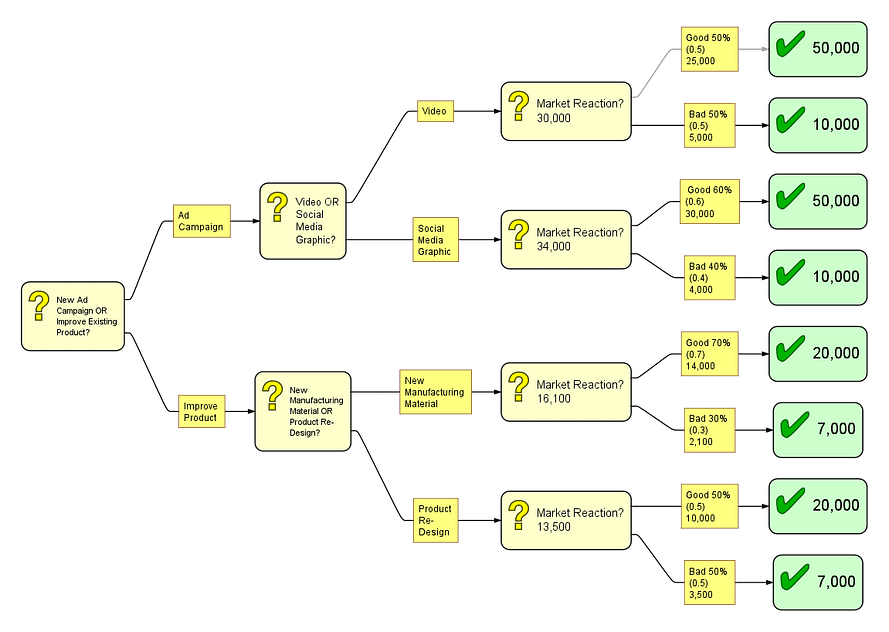
From here, add the new values that stem from one given Decision Entity, to get the value of the decision as a whole. To illustrate, we would add both the Good market reaction value of a Video ad campaign with the Bad market reaction value of a Video ad campaign, like so:
25,000 + 5,000 = 30,000
This is the prospective profit of the ad campaign branch. Repeat this step for each set of values that need to be added. This value can be recorded in the Decision Entity that the options sprout from. In our example, these are the Market Reaction entities.
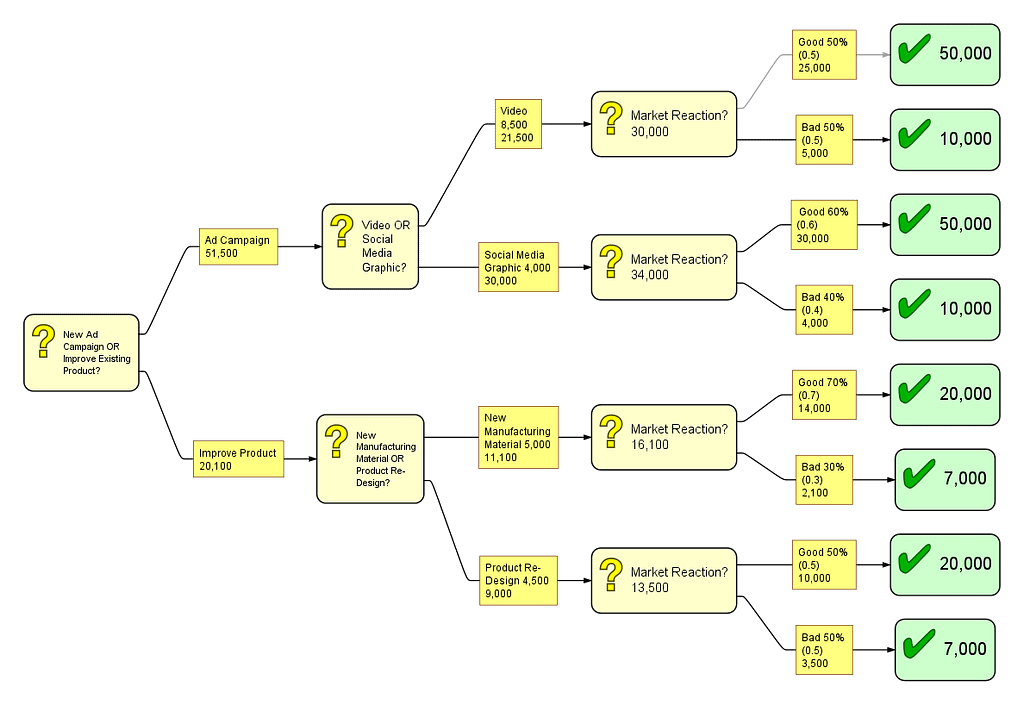
Step 4: Assign Monetary Costs to Options
In this step, we’ll label how much each initial option costs. In our example, the initial options will be if we’ll run a new ad campaign or improve an existing product.
These are costs that are already known, and take into account all of the costs that go into each option’s execution. To calculate them, first calculate the two options a given initial option branches into. For example, the initial option of running an ad campaign branches into two other options: a Video campaign and a Social Media Graphic campaign. Label each of these with their separate costs, and repeat with the second initial option. The tree should now look similar this:
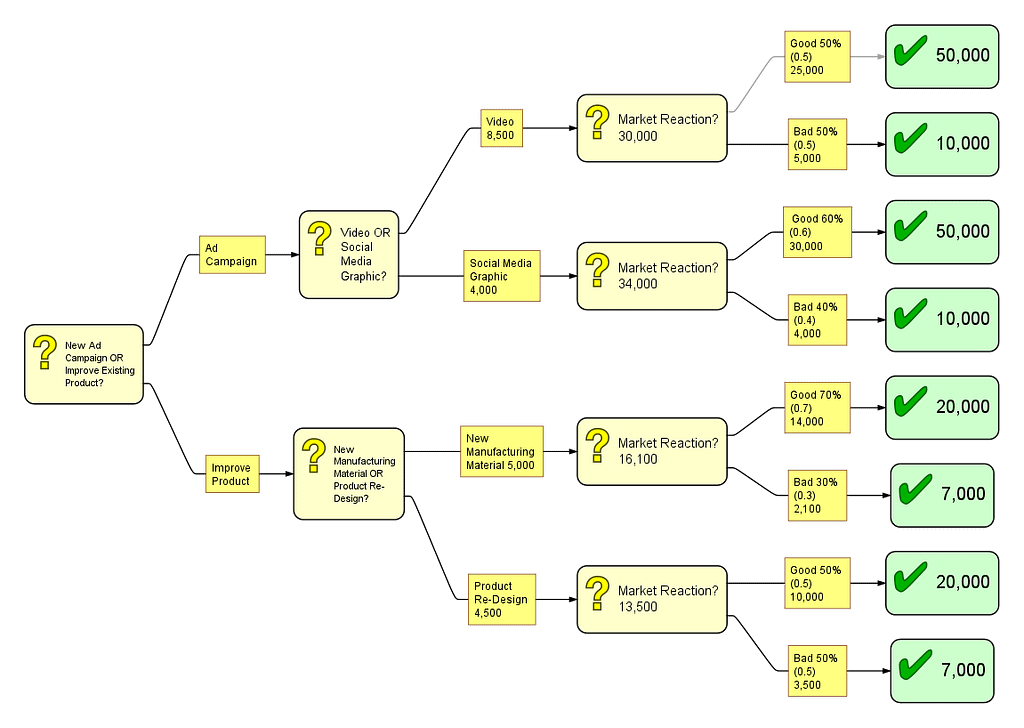
Then, subtract the cost of each option from the value listed in the Decision Entity it leads into. For example, the Video option leads into the Market Reaction Entity. So, that equation would be:
30,000 – 8,500 = 21,500
Repeat this for all options. You can record these at the bottom of their respective annotation boxes.
After all the new values have been calculated, you want to add the two that branch off from a given decision node. In our example, this could be the two options that branch off from the Video or Social Media Graphic Decision Entity. Therefore, we would add the new values from the Video option and Social Media Graphic option like so:
21,500 + 30,000 = 51,500
This represents the net profit running a new ad campaign is. Repeat this process for the other option, Improve Existing Product.
Step 5: Evaluate Options and Decide
From here, all that’s left to do is evaluate the options based on the values you’ve assigned, and choose which course of action you’ll follow. This doesn’t solely depend on monetary profit. You and other stakeholders should also consider what risks you are willing to take, how one option may have a larger effect on areas that aren’t monetary profit, etc. However, the tree is completely finished and the final step is to make a decision.
What’s Next?
Wanting to do more with Flying Logic? Check out these articles next:
How to Make a Family Tree With Flying Logic