
A SWOT analysis diagram is a powerful tool used in a variety of business, organizational and personal situations. SWOT (standing for Strengths, Weaknesses, Opportunities, and Threats) analysis diagrams are used to get a grasp of where a certain product stands, to identify and take advantage of opportunities, identify and improve upon any weaknesses, and overall lets you take a step back in order to get a better sense of where a company, product or process currently stands as a whole. By drawing information from both internal and external sources, this diagram creates a well-rounded view of the object being analyzed. Flying Logic can help organize this information, creating a comprehensible SWOT diagram for your needs.
Transcript continues after video.
Flying Logic Setup
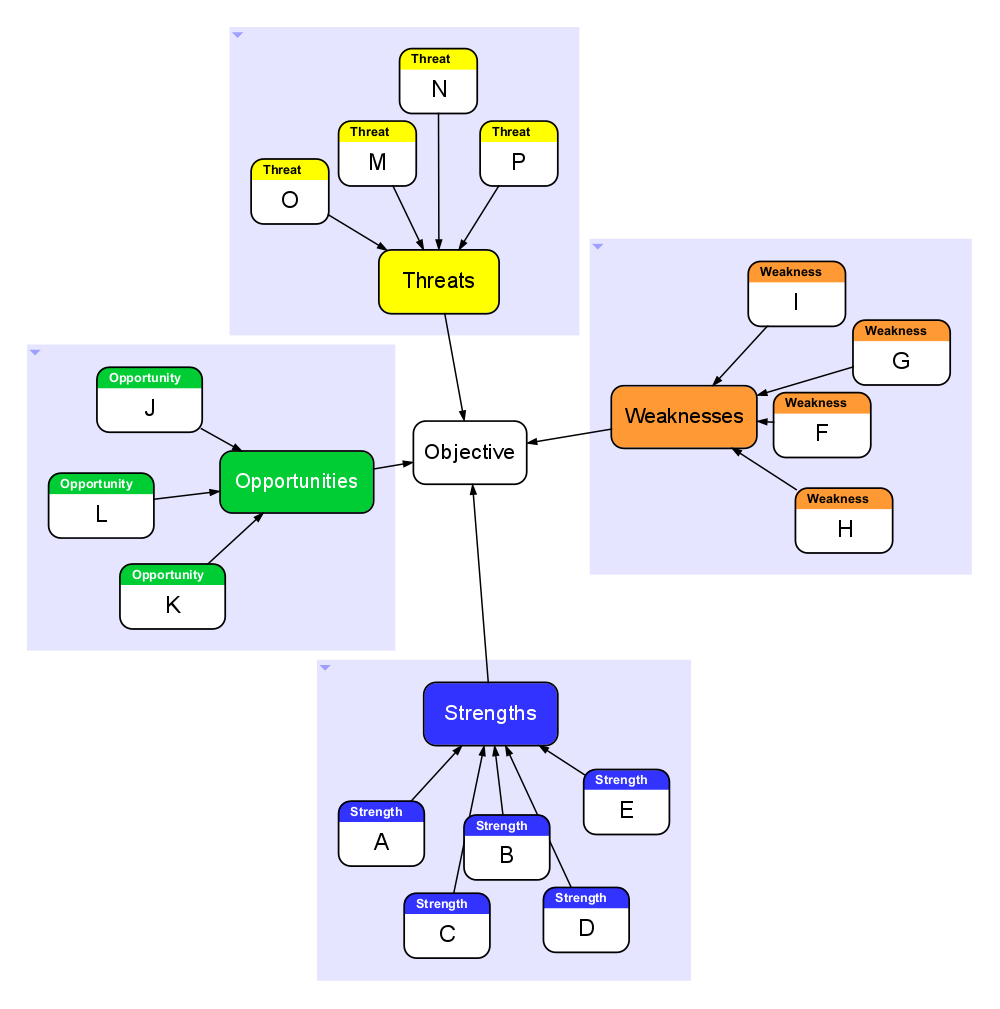
A SWOT analysis diagram is structured much like a mind map. However, the edges are flipped to flow from the outside Entities towards the center objective Entity. This makes it so that, when read along the edges, the Entities can be read in a sentence such as ” Entity is a strength of objective, ” or ” Entity is a Threat to objective.”
To change the settings, set the Orientation setting to Outer to Inner. The Bias setting will automatically change to None, since the Outer to Inner setting carries no Bias. It will grow outwards regardless of the order Entities are added.
The Operators setting can remain in its default state.

The SWOT analysis diagram Domain we use in this article’s example diagram is not built into default Flying Logic. For now, you can access it through this post in our forum.

To download and use the Domain, choose the bottom (third) file in the post: SWOT Analysis domain.xlogic. This will open a blank Flying Logic document with the SWOT analysis diagram Domain already in the Domain menu.
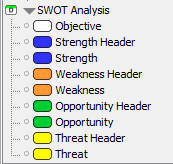
The Domain uses many Entities, however a few simply act as labels. The Entities are:
- Objective: the subject that you will be analyzing in the diagram
- Strength Header: this acts as a bridge between the strengths and the objective
- Strength: these are the Entities that list the objective’s strengths
- Weakness Header: this is the bridge between weaknesses and the objective
- Weakness: these are Entities that list the objective’s weaknesses
- Opportunity Header: this is the bridge between the opportunities and the objective
- Opportunities: these are Entities that list the objective’s opportunities
- Threat Header: this is the bridge between the threats and the objective
- Threat: these are Entities that list threats to the objective
Step 1 : Determine Your Objective
It’s helpful to determine what you’ll be conducting your analysis on before you begin. This is the “objective” of the diagram, and its Entity sits at the center of the chart.
Any SWOT analysis diagram will have a single objective, which will be what you’re planning on analyzing. This could be a specific product that your company sells, or a service you provide. This could also be a system or group of systems, or even an entire company as a whole. This diagram will work on both broad topics and very specific topics, making it very handy in most situations.
It’s important to constantly keep this objective in mind during the process of analyzing it to avoid drifting off topic, or amassing irrelevant information in your diagram.
You can drag and drop an Objective Entity from the Domain menu onto the canvas to start.

Step 2 : Gather Data
It’s helpful to have your data in one place, and draw from it during the analysis process. Therefore, we recommend doing a bit of research into your objective beforehand. Researching the objective of your analysis is a task in itself, as a SWOT analysis demands multiple forms of research from a variety of sources.
Examples of external sources are customer reviews, supply chain data, trends that span over time, world events, competitor standings, etc. These are things that are happen outside of your objective, and are not a direct cause of it. They will have an effect on your objective, however they are not tied to it.
Internal sources are revenue reports, articles written about the objective, employee opinions, design choices of a product, production costs, etc. These are tied to your objective, and they directly influence one another.
Sources can be any sort of media, report, or even personal opinion. For example, if you’re analyzing something that relies on sales for profit, staff within the sales department have valuable opinions to incorporate. Find information from a variety of different sources in order to get the most accurate view of the objective.
Step 3 : Analyze Strengths
You begin a SWOT Analysis with the strengths of your objective. These are essentially the advantages your objective has, either over its competitors, or within itself. For example, if your objective is a product, this could be what features make your product better or more sought after than similar products out there. If your objective is instead say, an entire company, strengths may be a great workplace dynamic, the reputation your company has, or where your company excels in comparison to its competitors. Strengths can take the form of interpersonal topics, revenue statistics, production processes, or public relations. Anything that gives your objective an edge over the rest of the industry. It’s important to note that strengths should already be present, and need no further action to create them.
You should be pulling research for strengths from both internal and external sources. Potential sources may be articles written about your objective, customer reviews, employee inputs, revenue reports, any third party you work with (such as production services), or even the physical aspects of an office environment. The places you draw strengths from will depend on what your objective is, but keep in mind to look in a variety of places for information in order to keep your analysis realistic.
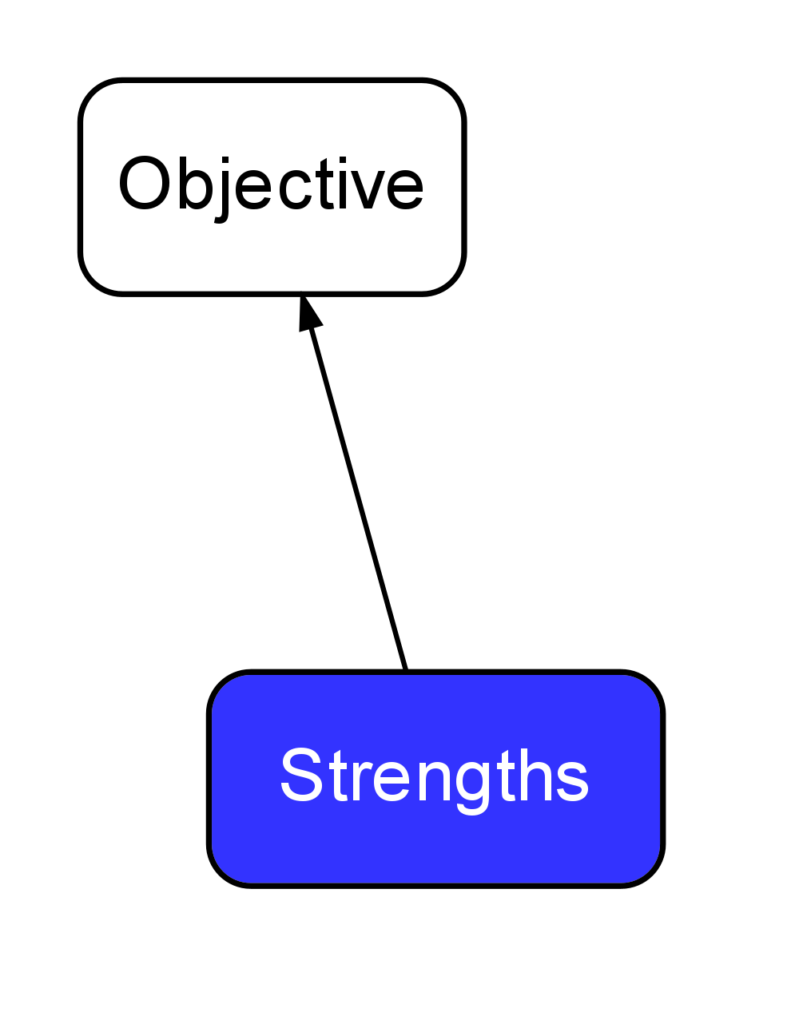
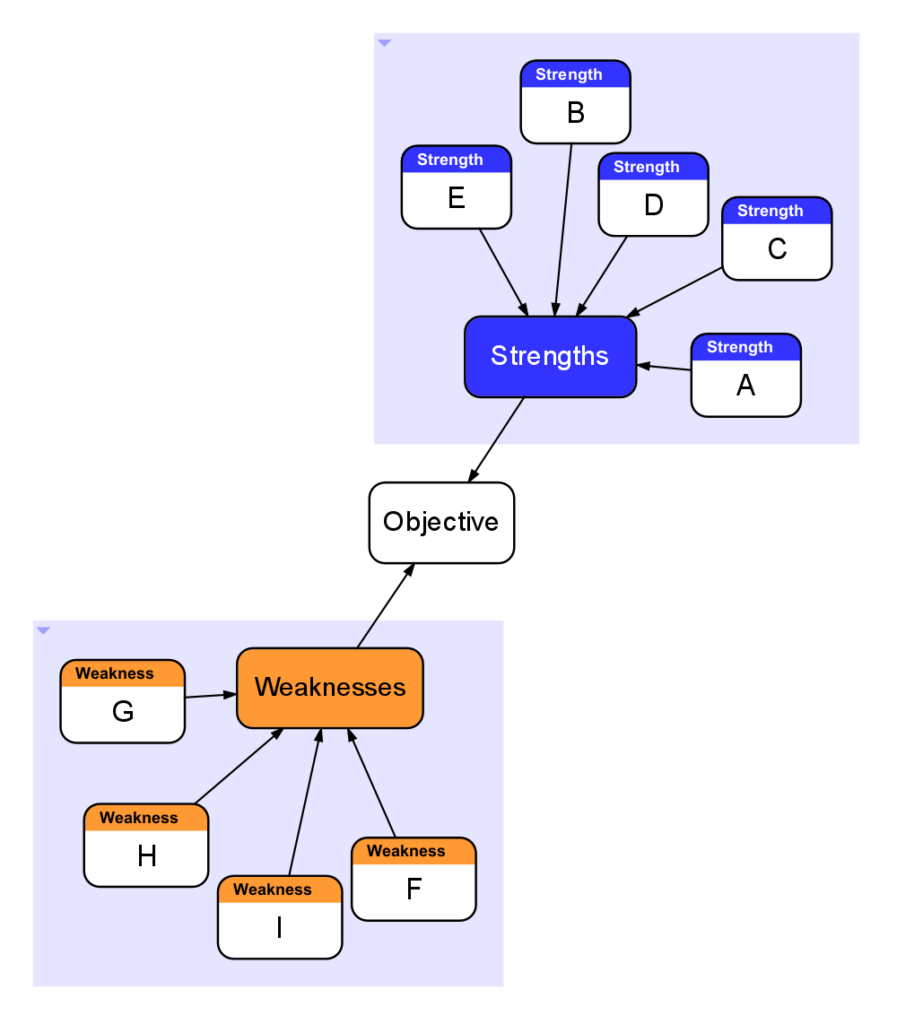
Begin charting strengths by adding a Strengths Header entity to your canvas. You can drag and drop it onto the Objective entity, and it will branch off automatically. Label the Entity “Strengths.”
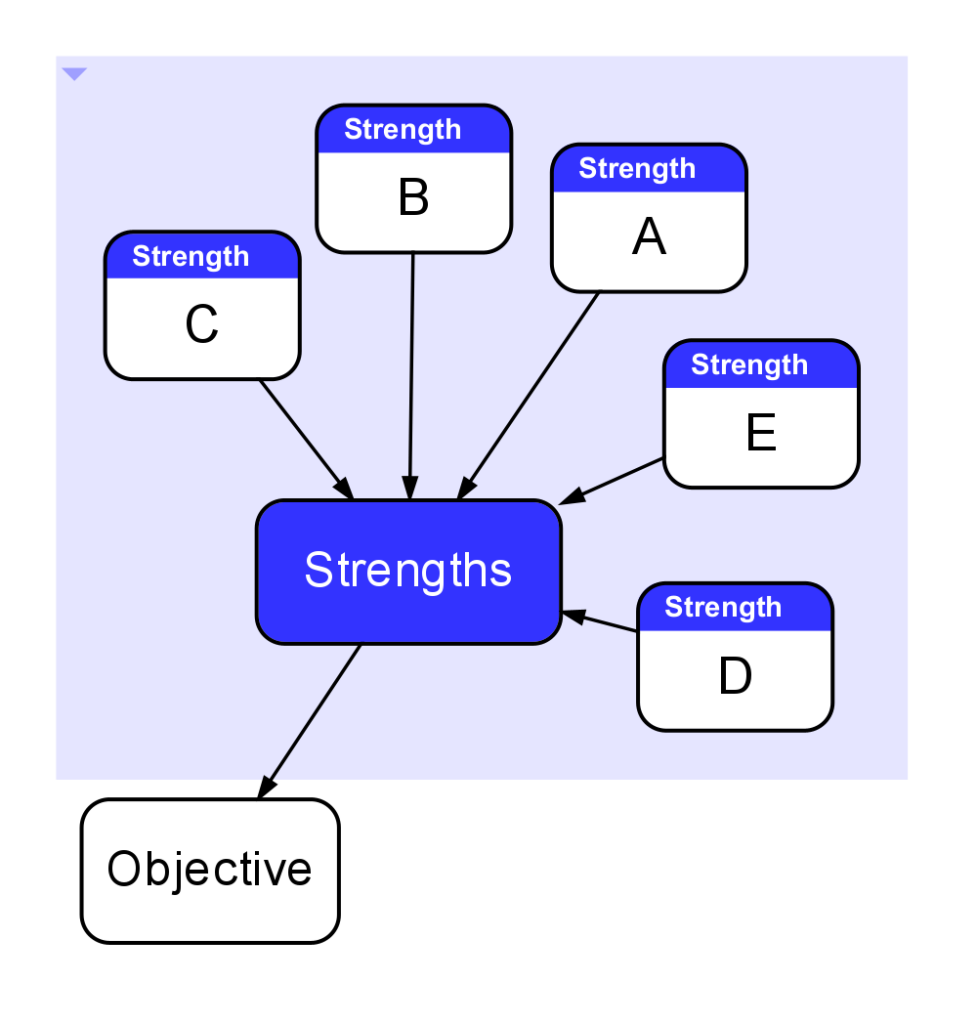
The next step is to add the strengths themselves. These are the Strength Entities, and they branch off of the header. You can drag and drop them onto the Strengths header and let them branch off.

The last step in adding Strengths to your diagram is to group them. This is an optional step that can improve clarity if there is an overwhelming amount of Entities. Traditional SWOT analysis diagrams have the different categories organized within their own boxes. To replicate this in Flying Logic, we can group these Entities. To do so, you select all of the Strength Entities, as well as the Strength Header. This is done by holding Option (for Apple) or CTRL (for Windows) and drag to marquee select a group of elements, or holding SHIFT and manually right-clicking all Entities. To group them, press COMMAND+G (Apple) or CTRL+G (Windows).
Step 4: Analyze Weaknesses
Analyzing the weaknesses of your objective is next. These are areas where your objective could improve, where it’s lacking in relation to competition, or inherent problems that need changing. If your objective is a product being sold, the weaknesses could be production or design issues. If you’re analyzing something broader, weaknesses could be snags within the company, bottlenecks slowing down a process, recurring issues or complaints from employees, or any negative reputations it may have.
NOTE: While identifying weaknesses, keep in mind that these are setbacks within the objective. It needs to be in your control, and you need to have the power to correct it, otherwise it isn’t a weakness, and may instead be a threat.
The sources you reference in your research to identify weaknesses may be the same or similar to those used for identifying strengths. These could be customer reviews, production complaints or issues, articles about the objective, revenue reports, etc. Again, make sure to look both inside your company and at how the outside views it. Find information from an assortment of sources.
Weaknesses are added to the diagram in the same way Strengths are. First, add a Weakness Header to the diagram, and label it “Weaknesses.”
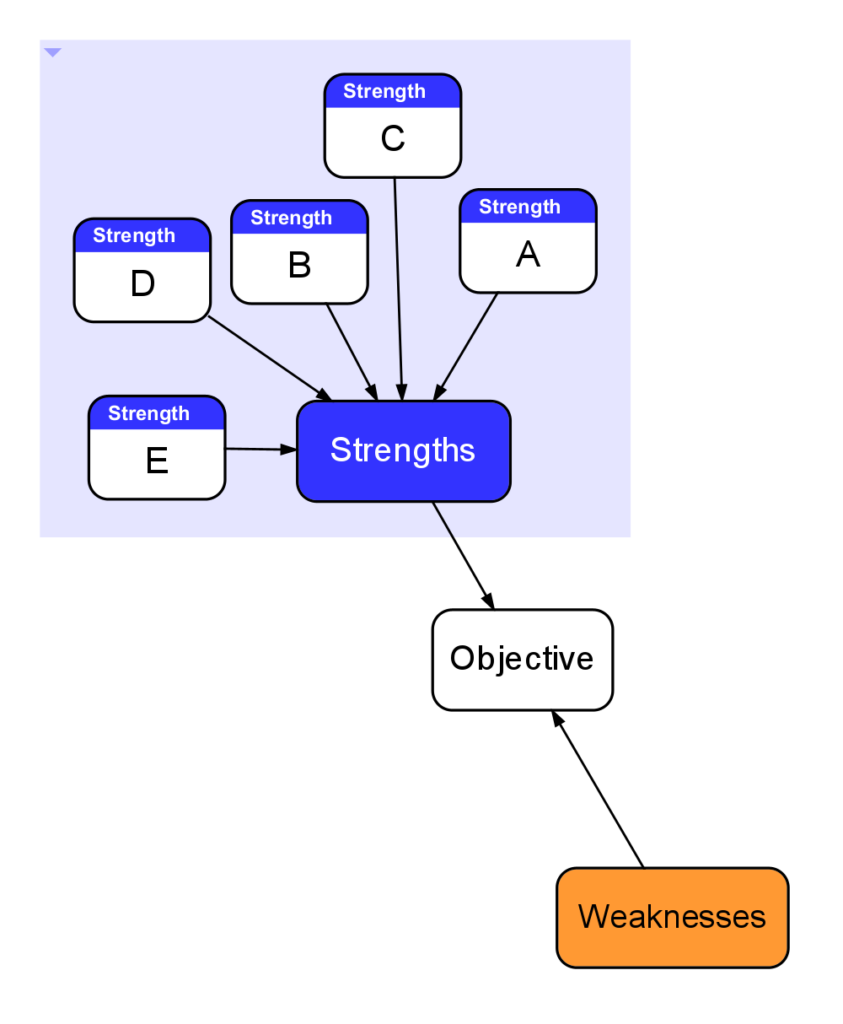
Entities branch off of the header, and are added by dragging and dropping the Weakness Entities onto the header.

Then select all Weakness Entities, and group them by pressing Command + G (Apple) or CTRL + G (Windows).
Step 5: Analyze Opportunities
Next on the list are potential opportunities. This is the category where you work on identifying ways to take advantage of things happening outside of your objective in order to improve it. For example, if your target audience changes, the objective can change with them. Another opportunity could be new technologies that are coming out that could benefit your company if you began using them. It might also be possible to broaden the horizons of the company as a whole, such as opening new locations or offices. Opportunities are external factors in the SWOT analysis, so data is drawn from external sources. Again, customers can provide helpful feedback. Look into the industries relevant to your objective, data trends over time, supply chain issues, current world events, competitors’ standings and reputations, etc.
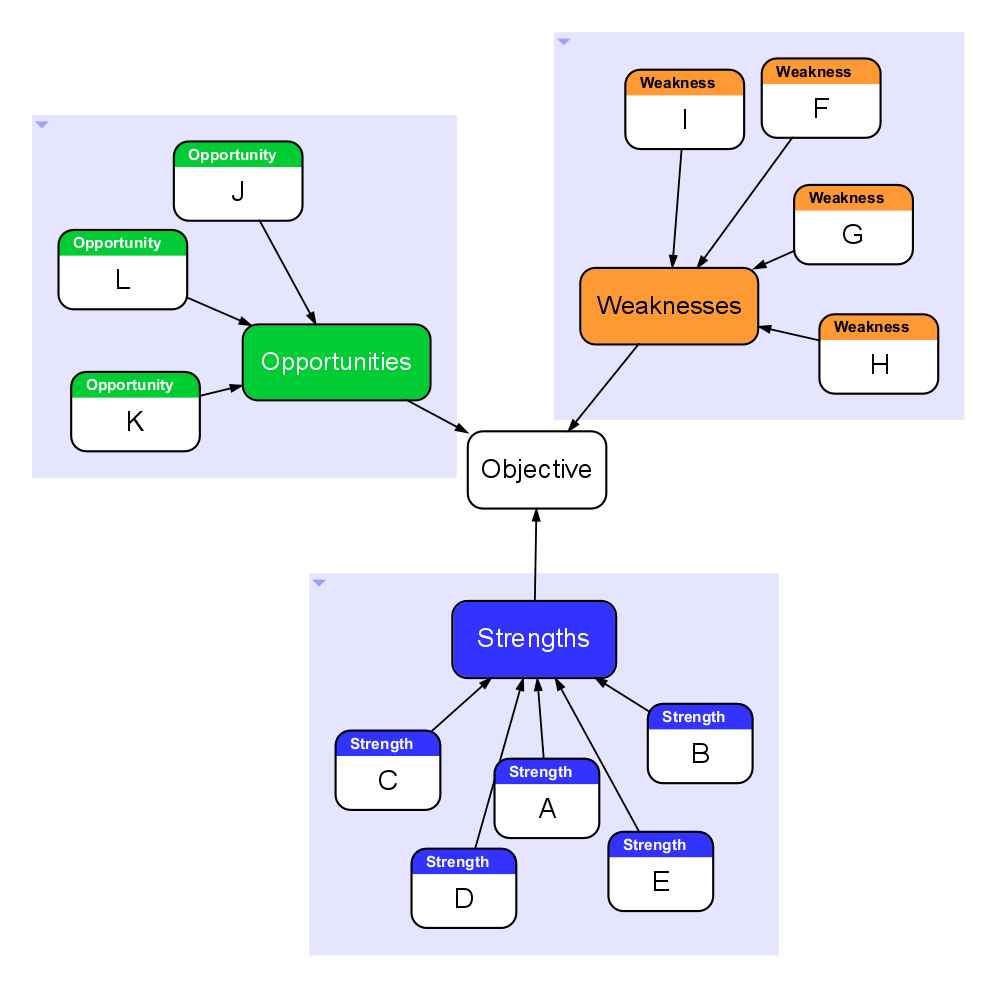
As is becoming routine, add the Opportunity header to the canvas, connected to the objective.
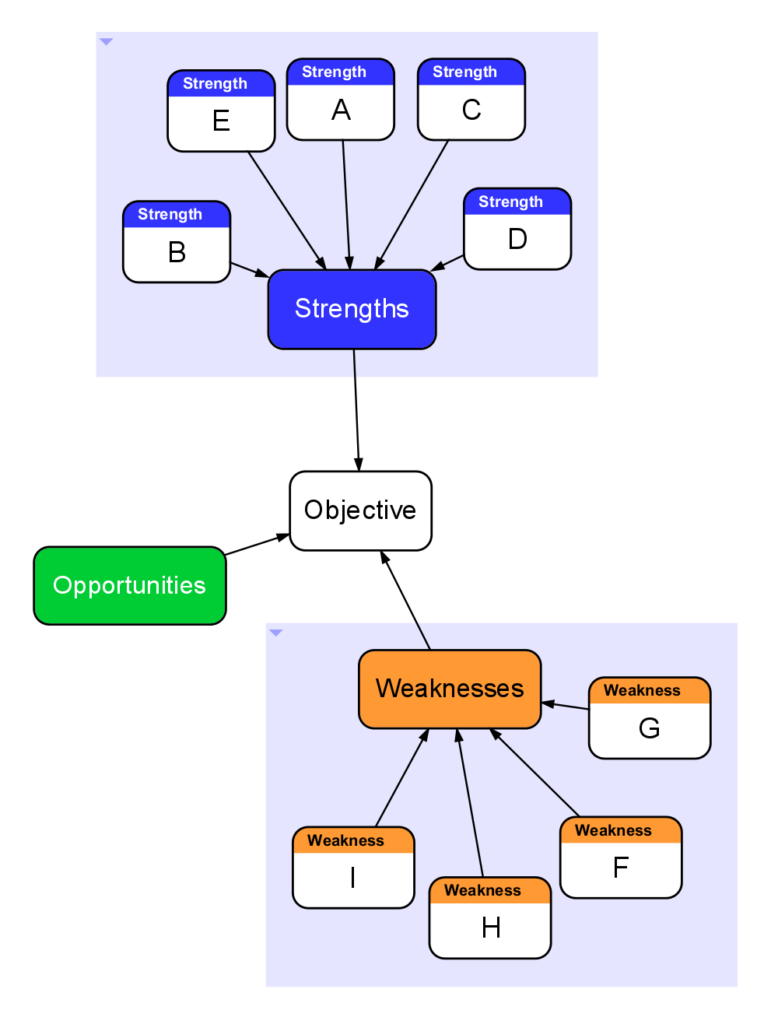
Secondly, add as many opportunity Entities as are needed, connecting them to the header.

Finally, group the Entities and header together by selecting all applicable Entities and pressing Command + G (Apple) or CTRL + G (Windows).
Step 6: Analyze Threats
The last part of the diagram is the threats. Threats are external factors that endanger your objective’s success. One of the biggest threats to a product is its relevance. Technology and culture can change to the point of a product becoming obsolete. Other threats could be a notable competitors or supply chain issues.
NOTE: Threats are factors that are out of your control, so instead of being able to fix them, the most you can do is create plans to sidestep them.
Similar to opportunities, threats are external factors, meaning data about them come from external sources. These could be feedback from customers and third party production companies. Other sources are data trends over time, competitors’ standings and reputations, industrial data and current world events.
Add a header for the threats, connecting it to the objective with an edge.

Then, add threat Entities. Connect those to the threat header.
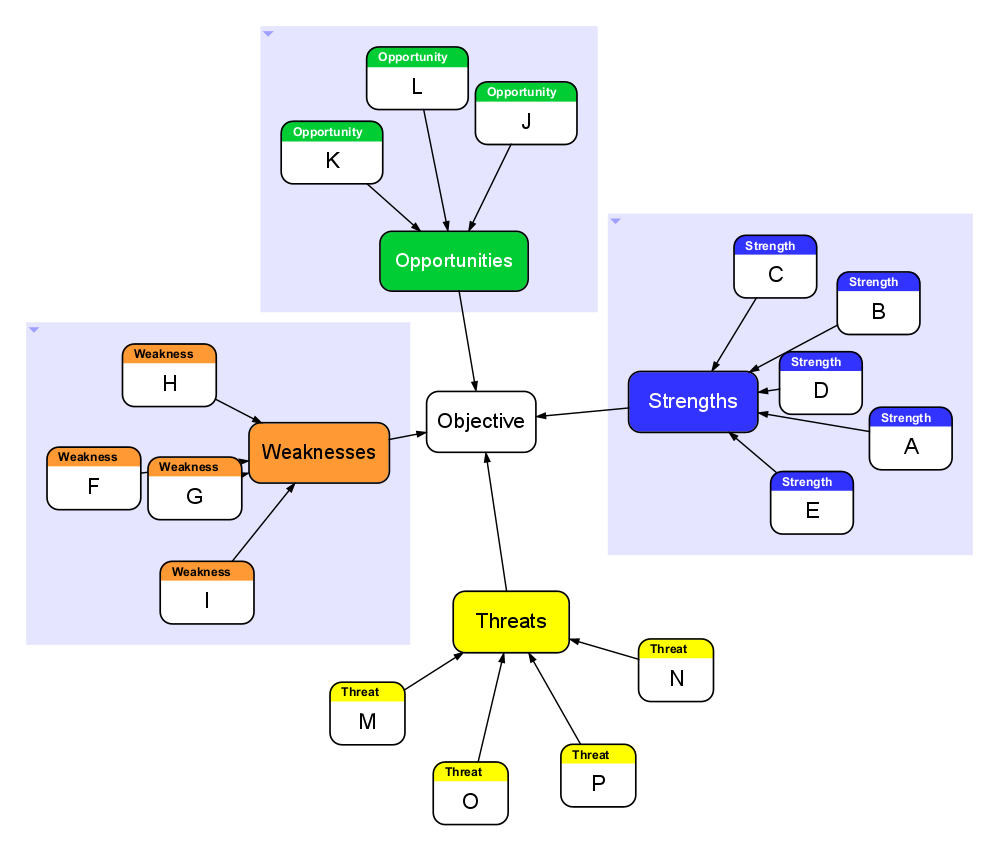
Finally, group them all together by selecting and pressing Command + G (Apple) or CTRL + G (Windows).
Step 7: Go on to Create a Plan of Action
The SWOT analysis diagram acts as a vault for improvement and building the objective a successful path forward. So, once your diagram is finished, you can create a plan of action or an improvement strategy using it as a reference. Finding ways to optimize strengths and opportunities, as well as creating plans to improve weaknesses and rise to threats are some of the steps in strategizing.
It’s possible to use all four categories to create a plan of action, although this isn’t necessary for all situations. In fact, some situations call for more a more specific plan of action. There are a few ways to use a SWOT diagram for strategy building, depending on your needs:
- Weaknesses and Threats: This strategy focuses on how to improve weaknesses, and minimize threats. This may be the best option for an objective that isn’t doing well, or to add a layer of protection in case an objective’s profits begin to fall.
- Weaknesses and Opportunities: This strategy focuses on how to minimize weaknesses, and maximize opportunities. This approach is the best when it comes to the overall improvement of the objective.
- Strengths and Threats: This strategy focuses how to maintain strengths and minimize threats. This is the most protective approach, and adds a defense to ensure your objective maintains its profits.
- Strengths and Opportunities: This strategy focuses on how to maintain strengths and maximize opportunities. This is optimal for an already strong objective that’s ready for growth.
What’s Next?
Wanting to do more with Flying Logic? Check out these articles next:
How to Create a Family Tree with Flying Logic