
Flowcharts are diagrams used to visualize a process or set of steps, to illustrate a decision tree, or to map out a complex system. Flowcharts are also useful for things such as understanding how steps in a process relate to each other, documenting a process for future reference, or making improvements to a process. Flying Logic can help you make complex flowcharts in a fraction of the time you’d need in any other tool.
Transcript continues after video.
Flying Logic Setup
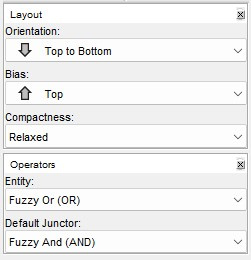
Most flowcharts are organized so that the beginning entity is at the top, and the following steps flow downwards, so you may want to use the Orientation popup menu to change the orientation of your document to Top to Bottom. Flowcharts don’t typically use Flying Logic’s confidence spinners, so you can leave the Entity Operator and Default Junctor Operator menus set to their defaults.
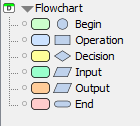
The flowchart domain uses the entities: Begin, Operation, Decision, Input, Output and End.
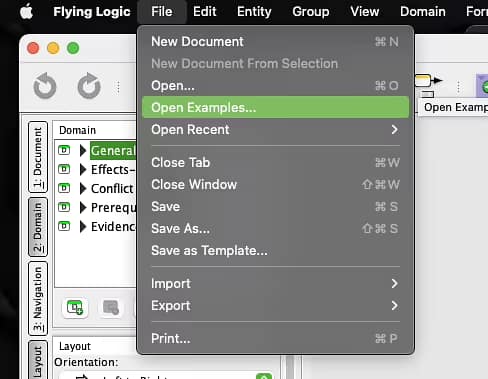
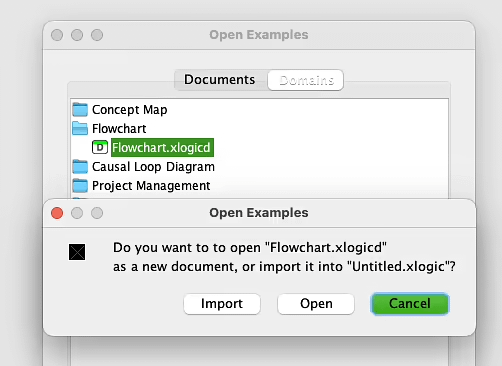
The flowchart domain is not included in a default Flying Logic document, so there are a few steps needed to import it into the document. To begin, open the “File” menu in the top right of the document, and select “Open Examples.”
This will open a window, and at the top middle select the “Domains” tab. This will show you a list of all usable Flying Logic domains, including those not included by default. Double click the “Flowchart.xlogicd” to open the options window for that domain.
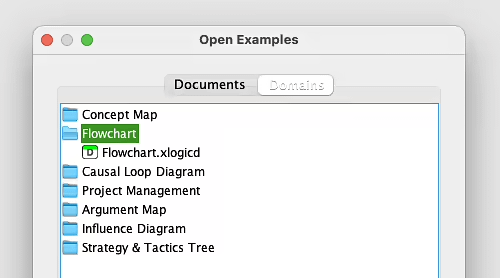
You will be given two options in the window: to “Import” the domain into an already opened Flying Logic document, or to “Open” a new Flying Logic document with the flowchart domain included. Either way, you’ll now be able to use the flowchart domain.
Step 1: Determine the Purpose of the Flowchart
It’s important to know what process your flowchart is going to visualize, or to have an idea of where your flowchart will begin and end. So before adding any entities to the canvas, you need to determine the purpose of your flowchart.
Flowcharts can be used in a multitude of situations, but are commonly used in business to help visualize a process, identify potential bottlenecks, and optimize efficiency. Flowcharts can also be used for personal purposes, such as mapping out a workout routine or tracking the progress of a project. Some useful question to ask yourself to get an understanding of your flowchart could be:
- What process is being mapped out?
- What are the individual steps in the process?
- How are the steps connected?
- What is the goal of the flowchart?
- What will the Flowchart be used for after it’s finished?
Once you and all other stakeholders involved understand why the flowchart is being made, you can begin creating it.
Step 2: Begin Building the Flowchart
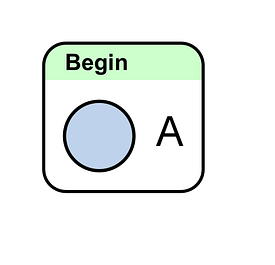
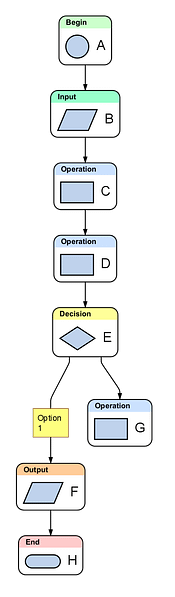
To begin a flowchart, you can add a Begin entity to your canvas. This represents the stage in the process you are currently at, or that a person will be at when starting the process. This may prove to be particularly difficult to identify if the process you are recreating loops back on itself, connecting the end to the beginning. In this case, you can choose the most logical of the steps to start with.
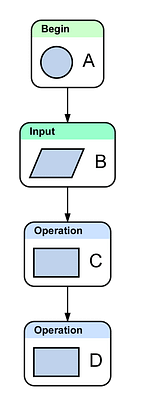
Once you have your beginning properly established, you can continue adding steps to your diagram. Check that the correct entities are being used for the correct type of steps:
- Operation entity: is oftentimes used for actions being made within the process, and will usually be the most reoccurring entity in the diagram
- Decision entity: represents a decision to be made, and will result in the flowchart branching in two different directions
- Input entity: represents information or product being added to the process
- Output entity: represents information or product that is output by the process.
- End entity: represents the end of the flowchart or a specific branch of a flowchart
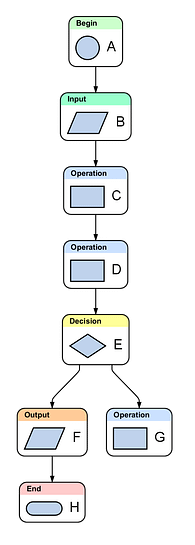
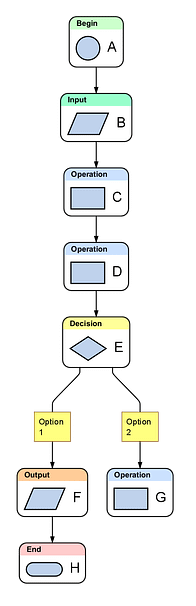
Step 3: Create Branches with Decision Entities
Decision entities will create the biggest change in a flowchart, as they will result in the chart branching into two or more different directions. A decision entity could represent a yes or no question, a this or that decision, or even a decision that could have multiple options to choose from. Because of this, it can be helpful to identify which path corresponds to which options presented by the entity.
To achieve this, select the arrow that leads from the decision entity into the following branch. Right click the selection and choose to Show Selected Edge Annotations. In the annotation box, you can label the following branch.
Make sure to repeat this for the other decision branches.
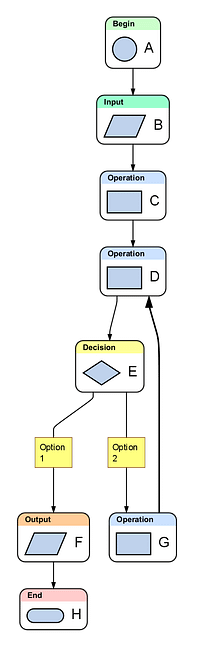
Step 4: Add Loops
Flowcharts commonly include loops, which are points at which some of the steps repeat one or more times. Loops usually include a decision that is used to decide whether the loop should exit, or continue to repeat.
To create a loop, simply connect the entity at the end of a branch to the preceding step it leads into. The arrow will flow against the direction of the flowchart, and the loop will become visible.
This “backwards flowing arrow” is called a Back Edge. Flying Logic automatically creates a Back Edge when it detects that it cannot connect two entities without creating a loop. Back edges will always be bold and will move in the opposite direction of the flow in the rest of the diagram. For this reason, it’s also important to ensure that the forward flowing edges are created first, so that Flying Logic is able to detect and create Back Edges for loops.
Step 5: Clarify the Flowchart
Once all the steps of the flowchart are on the canvas and connected properly, you can run through the process in your head, as if you were a computer or another person who had to execute the steps in the process. Make sure the steps are logical and that the process isn’t missing any steps.
It’s also useful to consult another person while clarifying a flowchart. For example, have them read the flowchart back to you so you can listen for mistakes. Oftentimes you become so accustomed to your diagram that mistakes are missed while reading, however these can be highlighted when it’s read out loud. You can also have the person ask clarifying questions, and give feedback on how to further improve the flowchart.
Lastly, make sure to sweep over for small mistakes or ways to make the flowchart simpler if needed. Maybe a few steps can be consolidated into one to make the diagram easier to follow. Whatever the case is, these steps can be removed by either deleting them, or detaching them from the chart and collapsing them into a group in case they need to be accessed later.
What’s Next?
Wanting to do more with Flying Logic? You may want to check out these articles: