
A process map is a visual representation of a given process that identifies the inputs, activities and outputs associated with each step in the process. Process mapping helps organizations better understand their core processes, enabling them to identify bottlenecks and other areas that need improvement. Process maps also serve as visual references for trainees, and decision makers can use them to gain insight into how different teams interact with each other and what to change to create improvement. Keep reading to learn how process maps work!
Transcript continues after video.
Flying Logic Setup
We’ve set the orientation to Left to Right, however any linear orientation will work for a process map. We set our bias to Left, meaning the entities push themselves to the beginning of the map as much as possible.

We use a domain that is specific to the scenario our example illustrates, meaning it may not be the best for your process maps. However, you can create your own domain, edit the domain we use, or use the General domain instead.

If you’d like to use or edit the domain in our example, this post contains the Flying Logic documents you can use to access it.

The first listed document is a blank Flying Logic document that includes the domain. This file is the easiest to begin mapping with. The second file is an editable Flying Logic document that includes our example map as well as the domain, and the third file is a PDF of our example .
Step 1: Identify the Process Being Mapped and Why
Before beginning your map, determine why you’re creating it. Is the process slower than it needs to be, or more complex than it needs to be? The goal may be to improve the process, to add to the process, or to reassign responsibilities to optimize skills. You may be documenting an existing process to help trainees understand it, or planning out how a future process will work. Whatever the reason, it’s helpful to identify the “why” before beginning your map, to keep it on track and reduce unnecessary additions.
When identifying which process to map, you should also identify the scope of the process. Labeling the boundaries of a process helps eliminate the possibility of unnecessary information during mapping. A few questions to ask while identifying the scope are:
- Where does the process start and end? (NOTE: A process map always has a single starting point, though it may have multiple ending points).
- What are its sub processes?
- Who participates in the process?
- How are responsibilities distributed?
- What are the inputs of a process?
- What are the outputs of a process? Does the process produce anything by the end?
Step 2: List Steps
It’s helpful to have all of the steps known, and gathered in one place, before actually organizing them into the diagram. This allows for a better understanding of a process before mapping, as well as serve as a helpful reference during the mapping process.
For now, the order of steps doesn’t matter. This is just to get every step listed, so that they can be organized later. However, it is helpful to add information while listing steps, such as who is responsible for a given step, or what sub process it is a part of. These additions help with organization later on.
While listing steps, make sure you speak with people who actually use and are a part of the process, as they can be helpful in understanding the ins and outs of a process that may not be seen by outsiders.
Step 3: Organize Steps
This is where the real mapping begins. After you’ve defined the purpose and scope of the process, as well as brainstormed and listed its steps, you can begin organizing the steps.
Step 3.1: Add the Starting Trigger
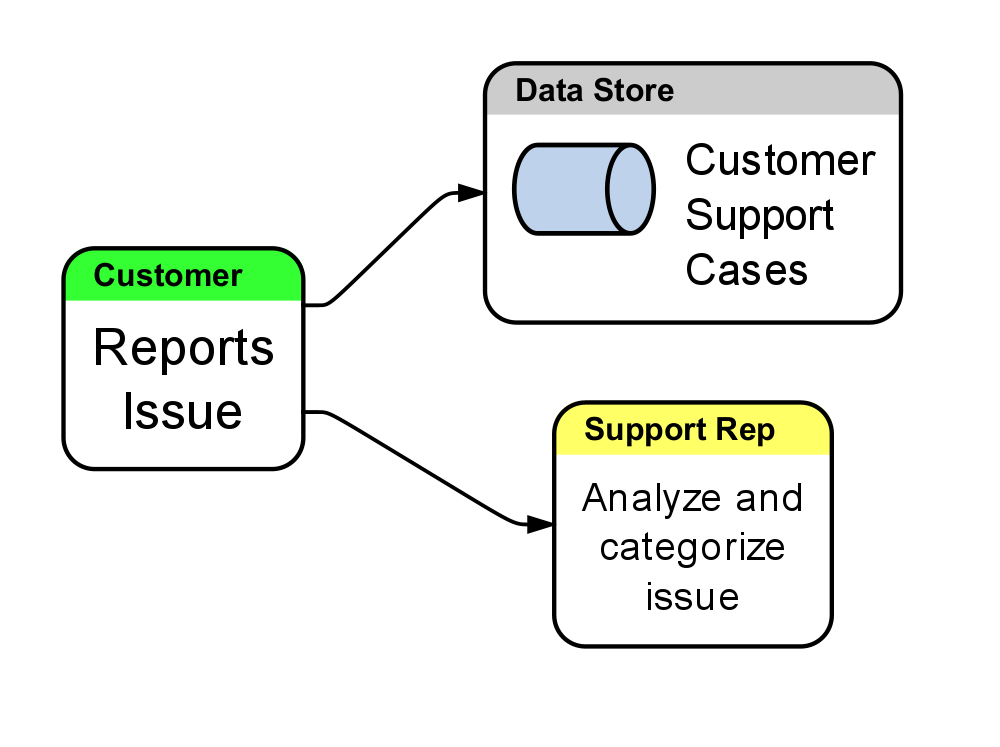
The starting trigger is the step that gets the whole thing rolling. You’ve already defined the starting point of the process earlier, so this shouldn’t be difficult. In our example, the starting trigger is when a customer reports a complaint.
To begin the map, add this entity by dragging and dropping it from the domain menu onto the canvas.

Step 3.2: Add Steps After the Trigger
Now, you can add the steps that follow the starting trigger. There may be one step following the starting trigger, or there may be multiple steps, as our example shows.
Add entities by either dragging them from the domain menu to the applicable drop zone of its preceding entity, or by dropping an entity onto the canvas and manually connecting two entities with an edge.
These steps will then branch off into new steps, and the tree continues like so:
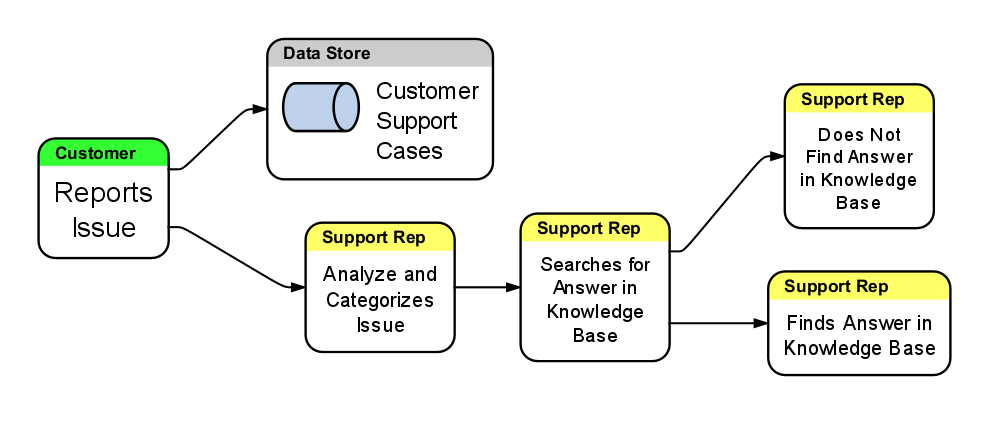
Step 3.3: Continue Building the Tree
Continue the above process for each step, until you reach the end points that you defined earlier. Each step will branch off into more steps, and each of those steps will branch out further. In complex processes, organization can get a little messy, so go through the process step by step, and reference the list of steps you created in step two.
Our map looks like this when finished:

Step 4: Create Groups
Grouping entities improves clarity, and may help to highlight certain aspects of the map. For example, we’ve created groups based on who is responsible for given steps. When you create groups in this way, Flying Logic will automatically move the groups into horizontal rows. This method of organization is called a “swimlane diagram,” and is specifically designed to highlight who is responsible for certain steps, as well as how people interact with each other throughout the process. Also, by labeling steps with who is responsible for them, you can better pinpoint where something is going wrong, or where a bottleneck is forming along a process.
NOTE: If you are using a vertical orientation for your map, the groups will create columns instead of rows. As long as they’re grouped according to who is responsible for which steps, this can still be considered a swimlane diagram.
Groups aren’t always categorized by responsibilities, they can also be created based on sub processes, the location a set of steps takes place, or any other restraint that makes sense for your map.
Make groups by holding Option (for Apple) or CTRL (for Windows) and drag to marquee select a group of elements, or by holding down SHIFT and manually right-click all relevant Entities. To group them, press COMMAND+G (Apple) or CTRL+G (Windows).
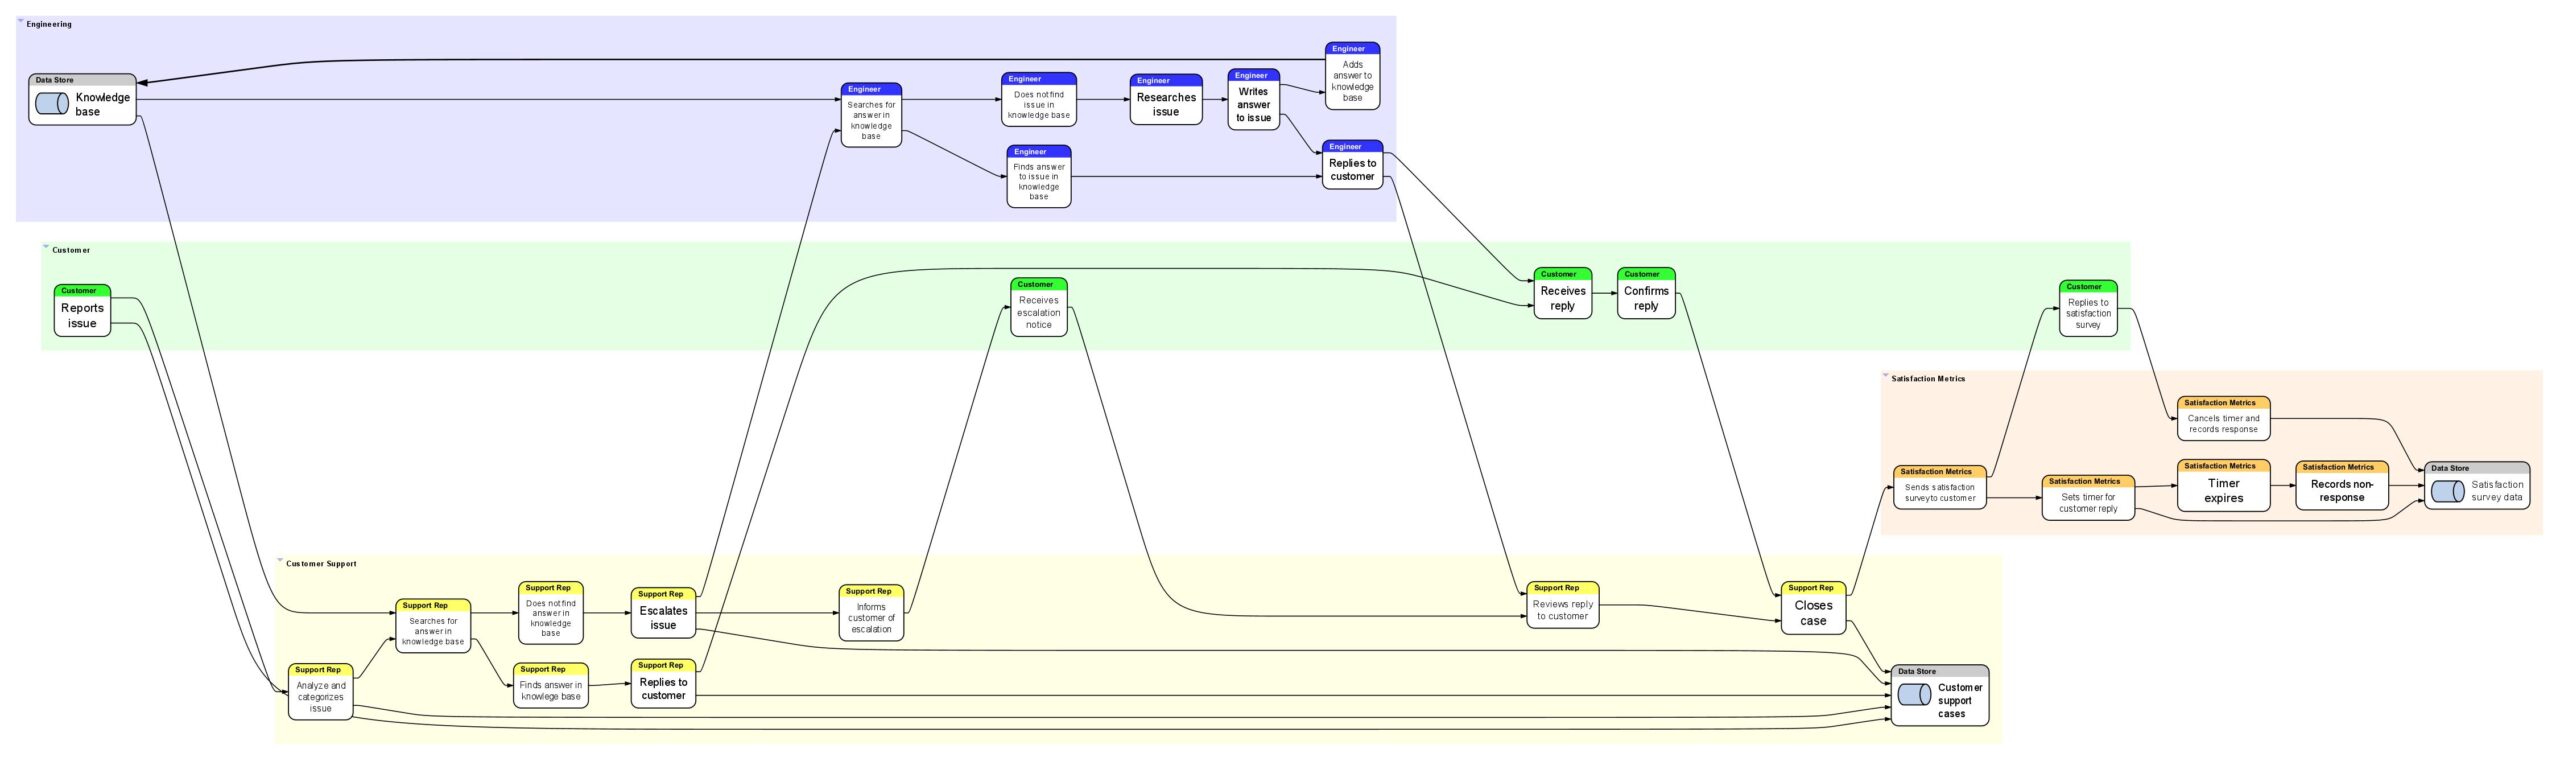
We named the groups so that it is clear who is responsible for the group. This is done by selecting the group (it will have a green outline around the group box when selected), and pressing TAB. A text box will appear, and then you simply type in the group’s name.
We also colored the groups, which is done by right-clicking the group, and selecting Group Color from the menu that appears. From there, simply choose a color.
Step 5: Analyze for Improvement
If you’re looking to improve the process, now is the time to do so. Analyze the process map, and look for bottlenecks, or snags that are slowing down the process. This could be a single step, or it may be an entire sub process. Some examples of bottlenecks are:
- Not enough employees for the current workload
- Incorrect skills for a certain task
- Incorrect tools for a certain task
- Overloading of data
- Unnecessary steps or communications
Successfully changing these aspects of the process should reduce friction within the process, and improve the process overall.
It is helpful to bring the people who are part of a process in while brainstorming for solutions, as they will have helpful insight and suggestions as to how to fix the process, or what they would need for it to run more efficiently. These employees can also be a helpful reference for ensuring that the map is as clear as it can be, and understandable enough that people who don’t work within the process or who weren’t part of creating the diagram can understand it. If the map isn’t clear, they may have some feedback on edits you can make.
Once bottlenecks are identified, all that’s left is to create a solution and execute it!
What’s Next?
Looking to do more with Flying Logic? Check out these articles next:
How to Create a Flowchart with Flying Logic