
When a non-trivial system (a for-profit business, a non-profit organization, a department, or a personal relationship to name a few examples) needs improvement, it is often not clear what to change, even to people who have a great deal of experience with the system’s workings. This is because systems contain many cause-effect relationships that interrelate in complex ways, and understanding the system sufficiently to decide what to change is often even more problematic because the people with experience often have only a narrow view of the parts of the system they interact with.
Transcript continues after video.
The Theory of Constraints (TOC) is based on the idea that all systems have a goal, or reason for existence. The rate at which a system can achieve its goal is called its throughput. The TOC also says that all systems have core drivers, which can be physical constraints, policy constraints, market constraints, or some combination of those, that have a major impact on the entire system and that ultimately (albeit indirectly) govern the system’s throughput. Ironically, the more complex the system, the fewer core drivers it is likely to have, due to the greater number of interdependent cause-effect relationships such systems contain.
The Current Reality Tree (CRT) is a tool for discovering the system’s core driver, which is also known as the constraint. The constraint is the cause that is most common to the most severe symptoms the system is experiencing, and thus the constraint must be managed most carefully in order to most dramatically improve throughput. By focusing on the constraint, you will realize the most “bang for your buck.”
Flying Logic Setup
A CRT is based on Sufficient Cause Thinking, and this is how Flying Logic documents are set up when first created, so you do not need to do anything special with the Operators popup menus to start creating your CRT. Most CRTs are drawn with root causes at the bottom and the symptoms at the top, so you may want to use the Orientation popup menu to change the orientation of your document to Bottom to Top.
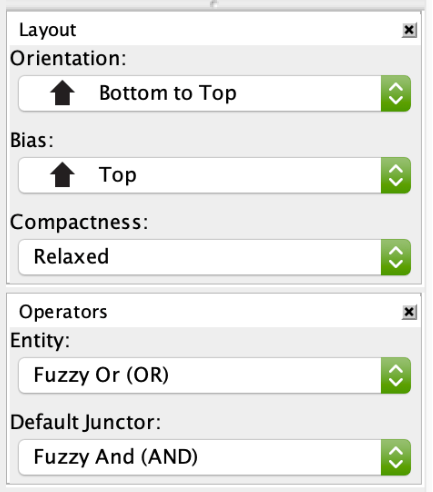
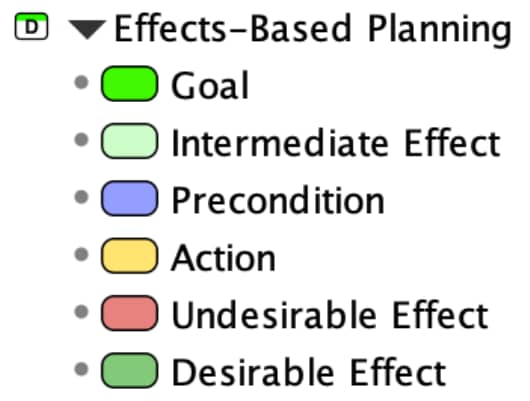
CRTs are created using the entity classes in the built-in Effects-Based Planning domain, and primarily use the following classes: Un-Desirable Effect, Precondition, and Intermediate Effect. CRTs are most often used to pinpoint problems, but can also be used to identify core strengths, in which case the Desirable Effect class can also be used.
Step 1: Understand the Scope
Before you can document how your system works and where its problems lie, you need to make sure you have a clear understanding of what you mean when you talk about your system. In other words: what are you analyzing? Spend the time necessary to reach a clear, written understanding with other stakeholders:
- What is your system’s goal?
- What are the necessary conditions for knowing the goal is being achieved?
- What measures do you use to use to know how well the necessary conditions of the goal are being met?
- Where do the boundaries of your system lie?
- What greater system is your system a part of?
- What systems does your system interact with?
- What are your system’s inputs and outputs?
Step 2: List the Symptoms
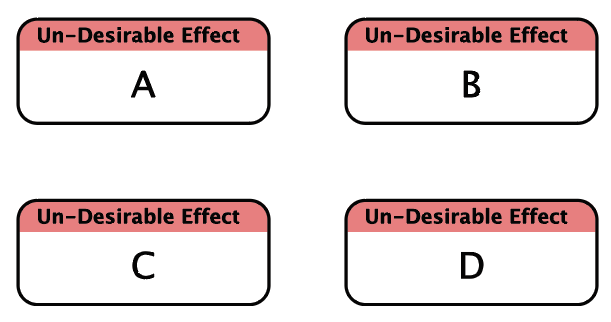
Presumably, you are doing your analysis because you believe the system would benefit from improvement, and because you see evidence of this potential benefit in various problems or symptoms of trouble. Such symptoms could be low profits, low customer satisfaction, or lots of arguments among family members. These symptoms are known in TOC as Un-Desirable Effects or simply UDEs. Usually there are between 5 and 10 UDEs that are causing the most difficulty in the system, and it is these UDEs that should be added first. Give each UDE a simple, present-tense title that is intended to be clear to any stakeholder, and make sure that the UDEs you choose at this stage are uncontroversial as to their actual existence. In other words, any stakeholder who looks at this list should have no difficulty agreeing, “Yes, these are some of the most serious problems we have.”
Step 3: Connect the Symptoms
Undesirable Effects are often contribute to other problems. As you study your list of UDEs, you will notice that some are probably direct or indirect causes of others already in your list. If this is the case, then connect these entities with edges (arrows) from the causes to the effects. Don’t be too concerned at this stage if the causes are not directly responsible for the effects: as you grow the tree, you will add other entities that complete the picture.
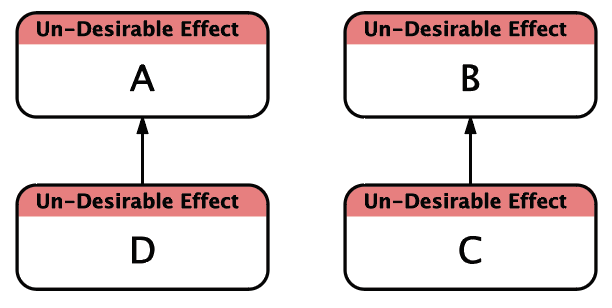
Sometimes you will notice that a single cause contributes to more than one effect, as is the case with D, below.
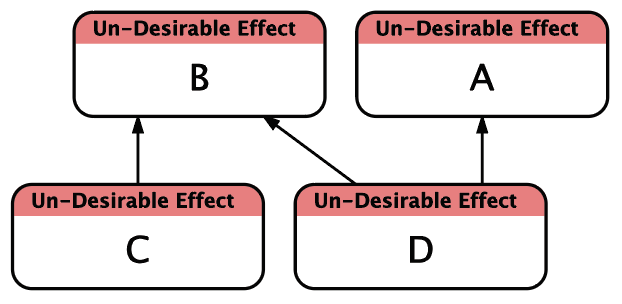
Other times you will notice that an effect has more than one independent cause, as is the case with B, above. When a Flying Logic document is set up for Sufficient Cause Thinking, more than one arrow entering an entity denotes more than one sufficient, independent cause. This is also called an OR relationship.
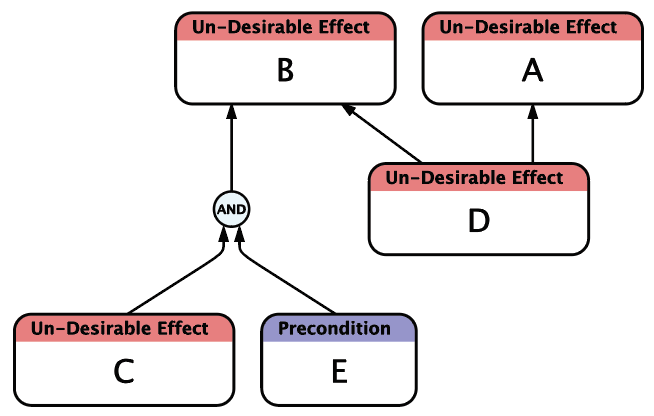
Often, a single cause is necessary, but not sufficient by itself to cause an effect. This is denoted by an AND junctor, which is created by dragging from the cause entity to an existing edge.
Step 4: Apply the Categories of Legitimate Reservation
The diagram as it stands is probably only an extremely rough picture of your system. By applying the Categories of Legitimate Reservation, you now add additional entities and causal relationships that create a true picture of the situation. In particular, look to add additional causes for the effects you have identified, and identify insufficient causes and add their necessary conditions. Also review your diagram for clarity, and step through it using Flying Logic’s confidence spinners. You can even change the class of an existing entity if, for instance, an entity that you originally added as an UDE now appears more neutral in context.
Use these guidelines to help you choose what class of entity to add:
- If an entity is undesirable on its face— in other words, if the system would definitely be better off without it— then use the Un-Desirable Effect class. UDEs can have predecessors, successors, or both, but should always have at least one causal connection into a completed diagram.
- If the entity is neither negative nor positive, but exists merely due to the larger context in which the system must operate and is something over which you have no significant influence, then use the Precondition class. Preconditions should never have predecessors, and should always have at least one successor.
- If the entity is neither negative or positive, but exists because of something within your control, then use the Action class. Actions are always causes and never effects, so they will have successors but no predecessors.
- If the entity is neither negative nor positive, but it exists as a consequence of other causes in the diagram, use the Intermediate Effect entity class. In a completed CRT, Intermediate Effects should always end up with both predecessors and successors.
Step 5: Continue Adding Underlying Causes
At this stage, you may have several unconnected, or loosely connected clusters of entities. In this step, search for and add deeper causes for the effects in your diagram, looking in particular to add causes that tie two or more clusters together. Of the causes that are currently at the root of your diagram, keep asking yourself, “Why is this happening?” and make your answer take the form of additional entities and the edges that connect them. Alternate between adding underlying causes and applying the Categories of Legitimate Reservation from the previous step.
Step 6: Consider Negative Reinforcing Loops
Although it is uncommon, sometimes the presences of an UDE at a higher level in your system actually aggravates UDEs at a lower level. Since this situation is so serious, it is important that you note it in your diagram as a causal loop, also known as a vicious circle.
Normally, all edges in a Flying Logic document “flow” from the start of the document (the root causes) to the end (final effects.) When you attempt to add an edge that would create a loop (that is, an effect indirectly becoming its own cause) Flying Logic creates a special back edge that denotes a causal loop. Back edges are thicker than regular edges.
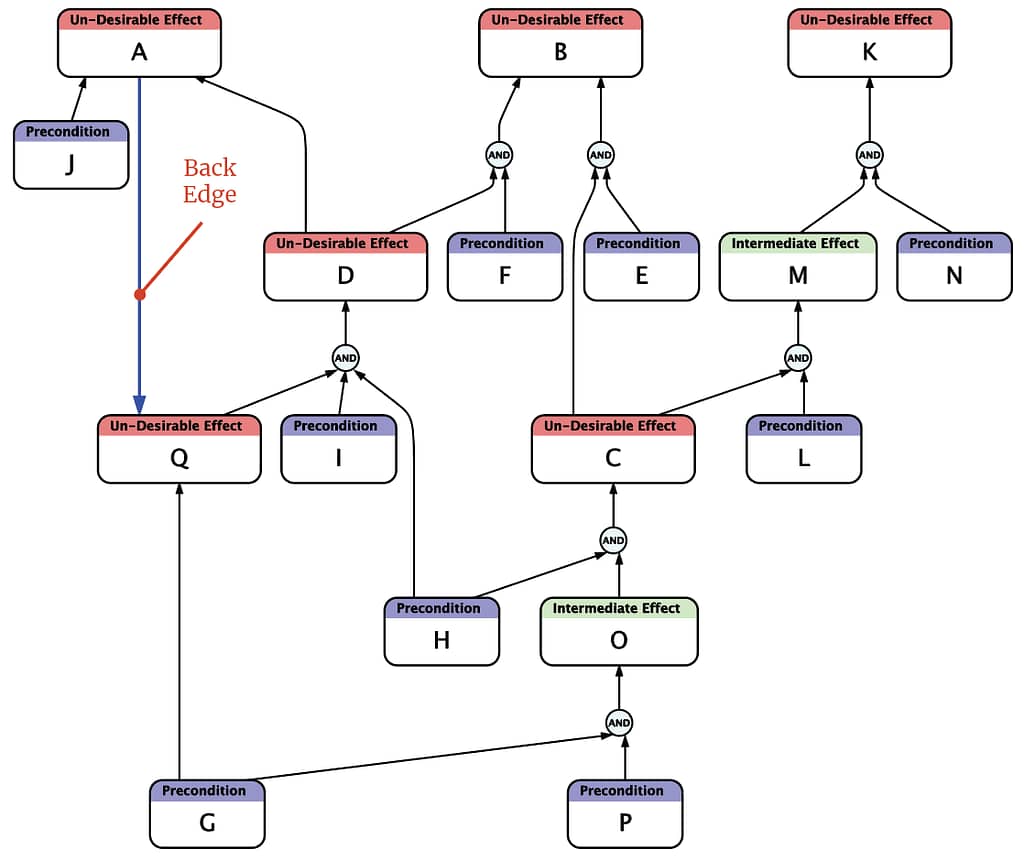
Back edges differ from regular edges in two ways: They do not have edge weights, and they do not participate in the flow of confidence values through the documents. They can, however, be annotated like other edges
Step 7: Identify Root Causes
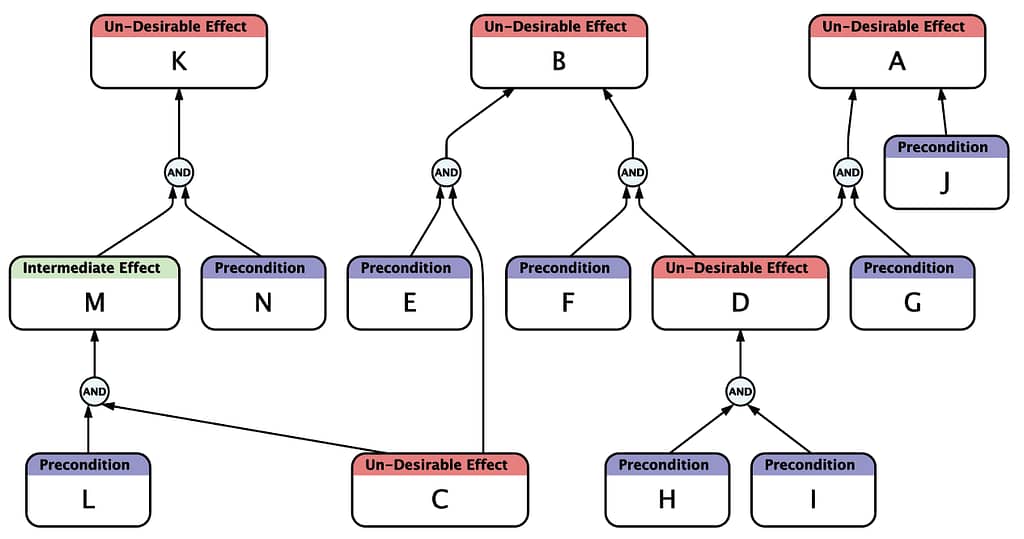
As your CRT becomes more complete, you will notice that one group of causes lie at its “root.” That is, they have successors but no predecessors. Some of these causes will be Preconditions and others may be UDEs, and they won’t necessarily appear at the bottom of the diagram. In the illustration above there are nine root causes.
The purpose of this step is to make sure you have built down your tree to the point where you have uncovered the deepest causes over which you have some control or influence. Preconditions are by definition out of our control, but you should question whether the preconditions at the root of your CRT aren’t really Intermediate Effects with other underlying causes. Also question whether the UDEs at the root of the tree don’t have additional underlying causes that you also control. The idea is to “uproot” problems at their deepest possible level.
Step 8: Trim the Tree
At times you may discover that parts of the tree you have built have little or no connection, as successors or predecessors, to the UDEs you care about. To keep the tree manageable, you should remove these clusters from view by either
- Deleting them,
- Using Cut and Paste to move them to a different document, or
- Placing them into a group which is then collapsed.
Step 9: Identify the Core Driver
If you have constructed your CRT rigorously observing the rules of cause and effect, you will agree that eliminating a root cause will also cause a chain reaction of other problems being eliminated. If this doesn’t appear to be the case, go back and make sure that at each step in the diagram, you have identified and added all the necessary and sufficient causes of your UDEs (Step 4), and that you have built the tree down as far as possible to root causes that you control or influence (Step 5.)
The time has come to identify the single cause that has the most influence over the most critical UDEs in your CRT. This single cause is the Core Driver (also call the constraint, or the bottleneck): the cause that must be managed or eliminated in order to break through the boundaries that hold your system back.
Although your CRT may contain several root causes, all of which may eventually need attention, you can find the Core Driver by judging several factors for each root cause:
- How many UDEs they indirectly cause,
- How severe are the UDEs they indirectly cause, and
- How much control or influence you have over them.
To aid in your analysis, you can select one of your root causes and select Edit ➡ Select Successors. Alternatively, you can select one of your effects and select Edit ➡ Select Predecessors. Use this technique to quickly get an idea of how influential each of your root causes are, although you will still need take the severity of the UDEs into account.
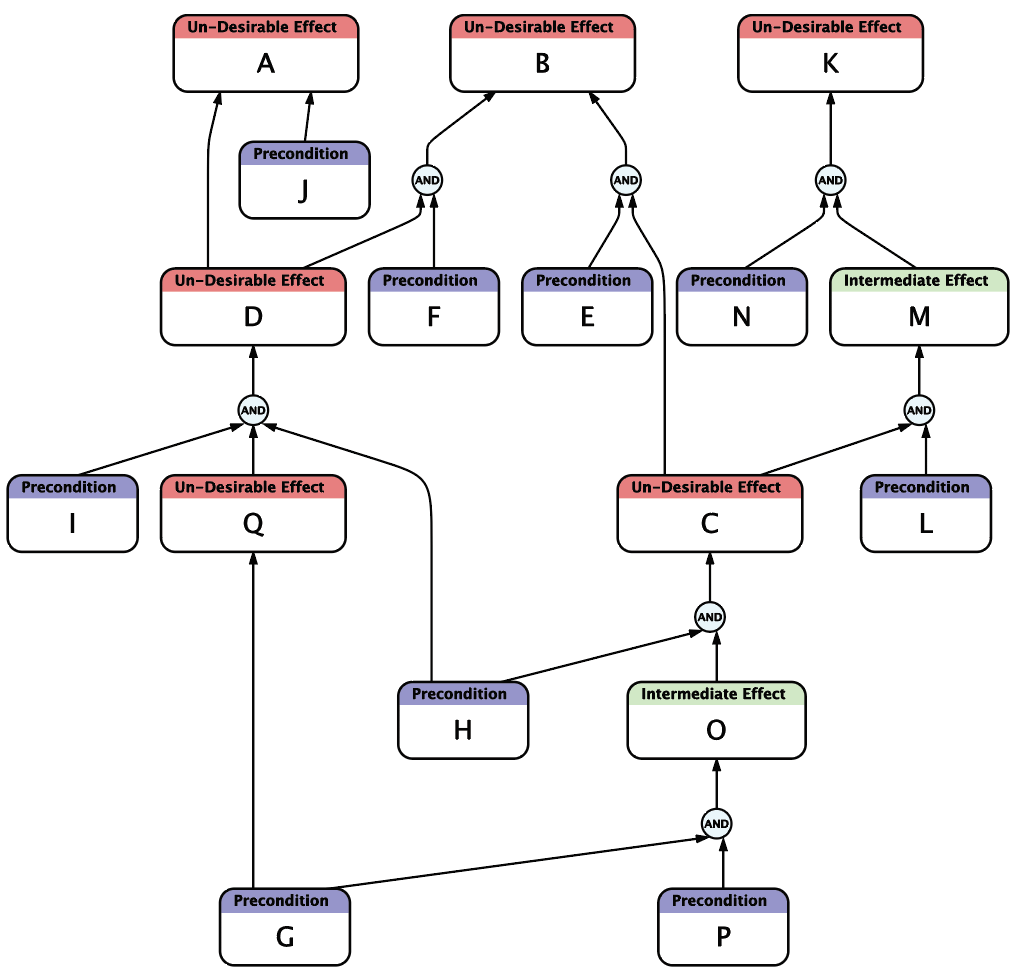
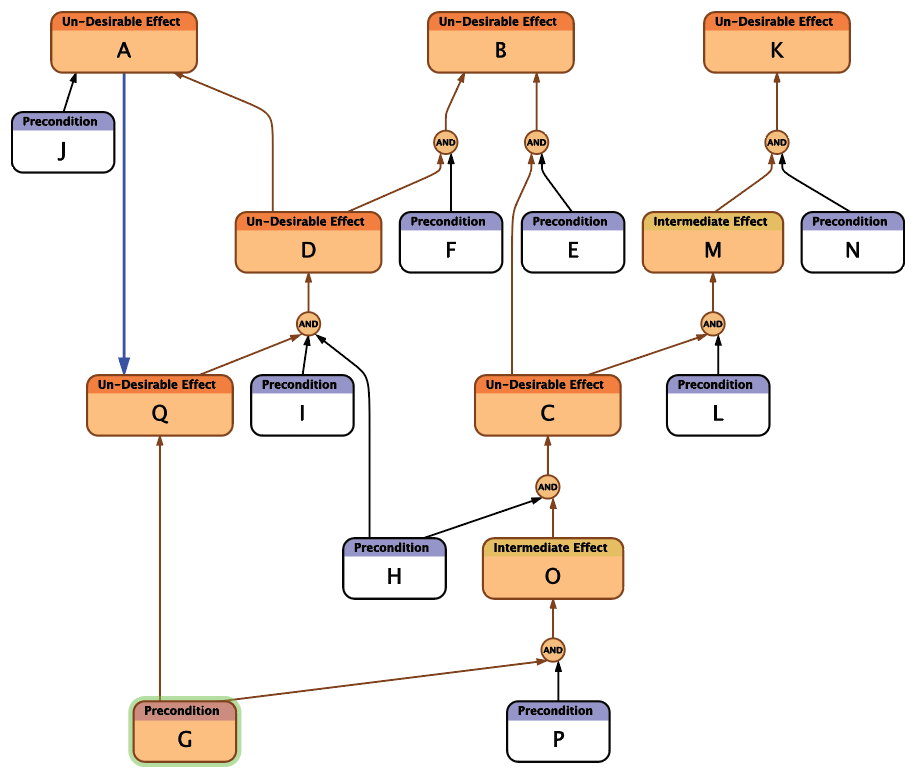
In the illustration below, entity G has been selected along with its successors, which makes it obvious that it contributes in some way to every UDE in the diagram. Since all of the causes in the diagram are at least within our influence, we conclude that G is our Core Driver: it is the constraint on which we must focus.
What’s Next?
Wanting to do more with Flying Logic? You may want to check out these articles:
How to Create an Evaporating Cloud